
A map is only as good as the landscape behind it.
In EDGY, Intersection Group’s open enterprise design language, maps do what real maps do: they show the landscape and features of the enterprise. Intersection Group describes the Milky Way map as “a shared map to find your way around your enterprise.”
But a map can’t exist without the ground it describes. In an enterprise, that ground is the elements (purposes, capabilities, processes, products, journeys, systems, teams) and the relationships that connect them across the whole organisation. Model those, and you’ve surveyed the landscape.
That’s the approach we’ve taken in FacetworX. It has two places to work: Modelling, where the landscape takes shape, and Maps, where you look at it from the viewpoints EDGY describes.
Modelling: surveying the landscape
Modelling is exploratory. You add elements as you find them, from a workshop, a spreadsheet or a conversation, and relate them across the enterprise: which capabilities a process realises, which systems a capability requires, which products serve which customer tasks, which teams make it all happen.
FacetworX checks every relationship against EDGY as you go, so the landscape stays consistent, and the Enterprise Twin follows those relationships to answer what-if questions, such as what breaks if a system fails. Diagrams on the Modelling tab are free-form: place what you like, where you like, and let FacetworX arrange it in EDGY’s facet bands when you want a tidy start.
Maps: the landscape from different viewpoints
The EDGY reference gives every element type its own map, and each map rests on one structure. FacetworX draws them straight from the model, so there is nothing to arrange and nothing to keep in step by hand:
| Structure | EDGY maps | How FacetworX draws it |
|---|---|---|
| Tree | Purpose, Content, Organisation, Brand, Capability, Product and Task Maps | Three ways, after EDGY’s notations for a Tree: Explicit, a top-down chart joined by tree lines; Stacked, each element inside the one that contains it; or Indented, each listed beneath the one that contains it, like an outline |
| Tree and flow | Process, Story and Journey Maps | Steps in the order they follow each other, inside the element they belong to; journeys in the order people go through them |
| Flow | Outcome and Activity Maps | Elements in step order |
| Tagging | People and Channel Maps | Grouped by the tags you choose, such as customer, partner or regulator |
| Links | Asset and Object Maps | Arranged by how they are linked |
| Across the enterprise | Service Blueprint and Milky Way Map | Several element types together, journey by journey |
One tree, three ways to draw it
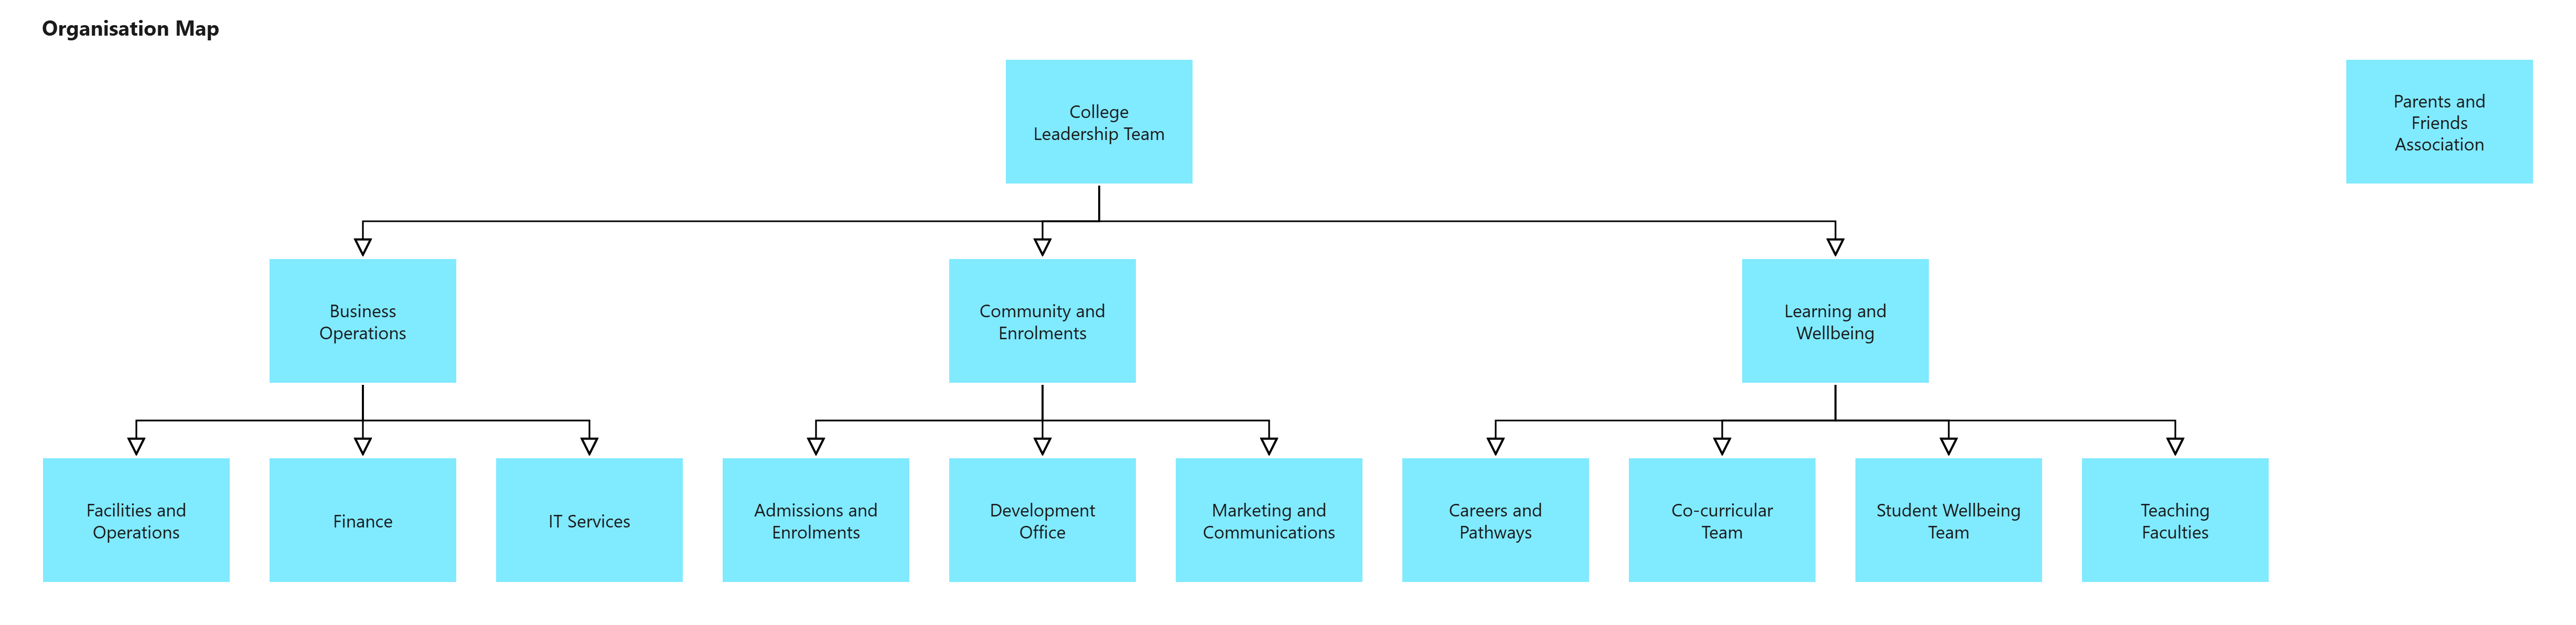
Organisations and purposes are trees: a leadership team over divisions over teams, a purpose over commitments over goals. Explicit is the classic org chart. Indented reads like an outline, with the top of the tree heading the map and each branch listed beneath it, which keeps a wide organisation compact.


Stacked: the jobs people set out to do
On the Task Map, each bigger job a family sets out to do is a stack of the tasks that make it up, built from the bottom up, and the stacks stand side by side in the order of the journeys they belong to.

Journeys in sequence
Journeys flow from one to the next in the order people go through them. Model that sequence once, by connecting journeys with a Flow on the Journey Map, and every map that runs journey by journey follows it: the Task Map above, the Service Blueprint and the Milky Way Map.


One landscape, many views
- Always in step. Change the model and every map changes with it. There is one version of the truth, seen from many angles.
- As many maps as you need. Start a map from any element, such as one division’s org chart or one capability area, and keep several of the same kind.
- See what’s missing. Beside each map, FacetworX lists the elements that aren’t yet part of a hierarchy, a flow, a tag group or a link, so you know where the landscape still needs surveying.
- Take it with you. Every map exports as an image or as editable PowerPoint shapes.
Try it
Modelling and Maps are in FacetworX Browser, which is free, runs entirely in your web browser and keeps your models on your own computer. Or open the online demo and explore Lakeside College: switch to the Maps tab and choose + New map.
EDGY is created by Intersection Group and published at enterprise.design under the CC BY-SA 4.0 licence. FacetworX is an independent tool by 10K1W and is not affiliated with or endorsed by Intersection Group. Lakeside College is fictional.
Leave a Reply